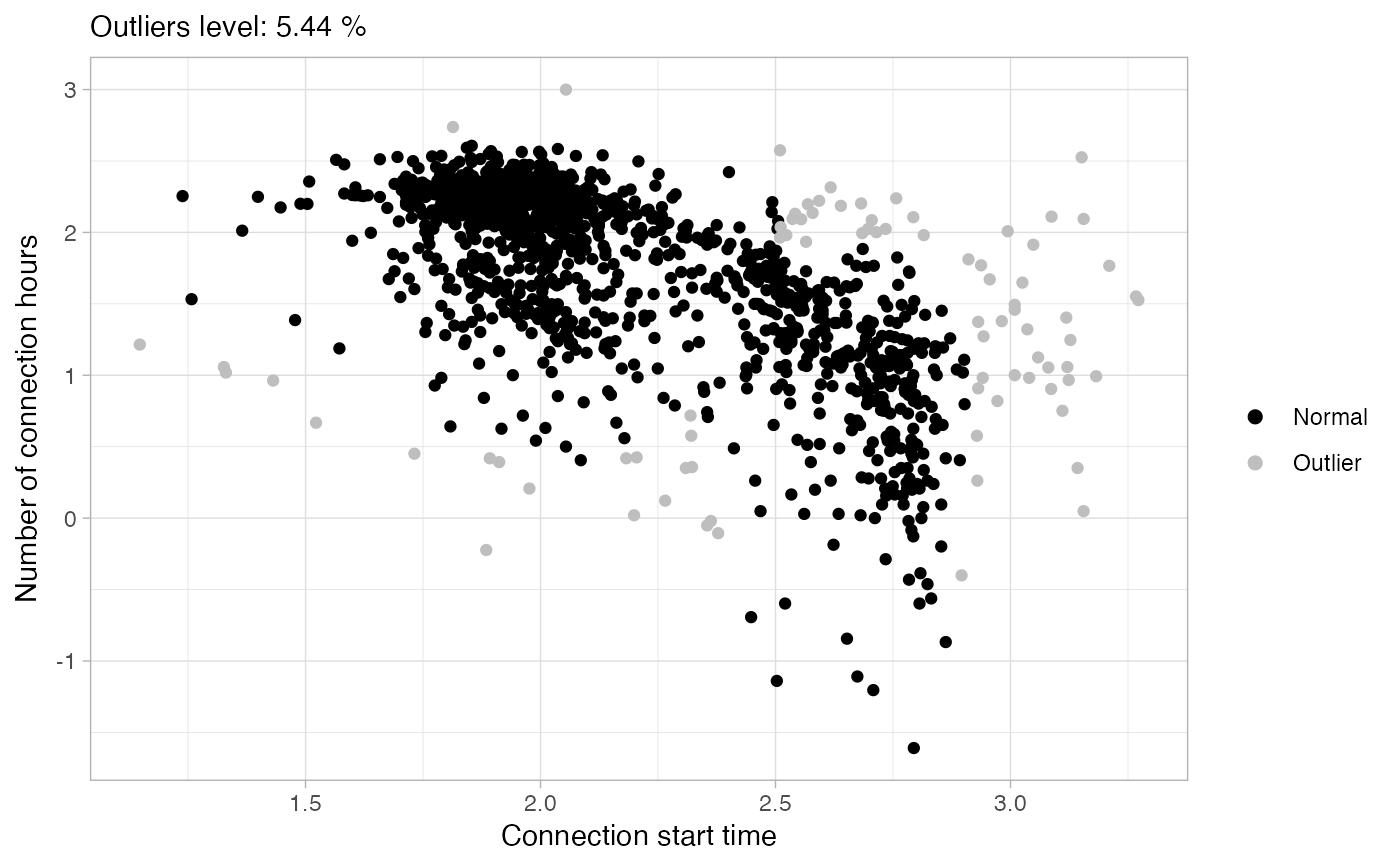
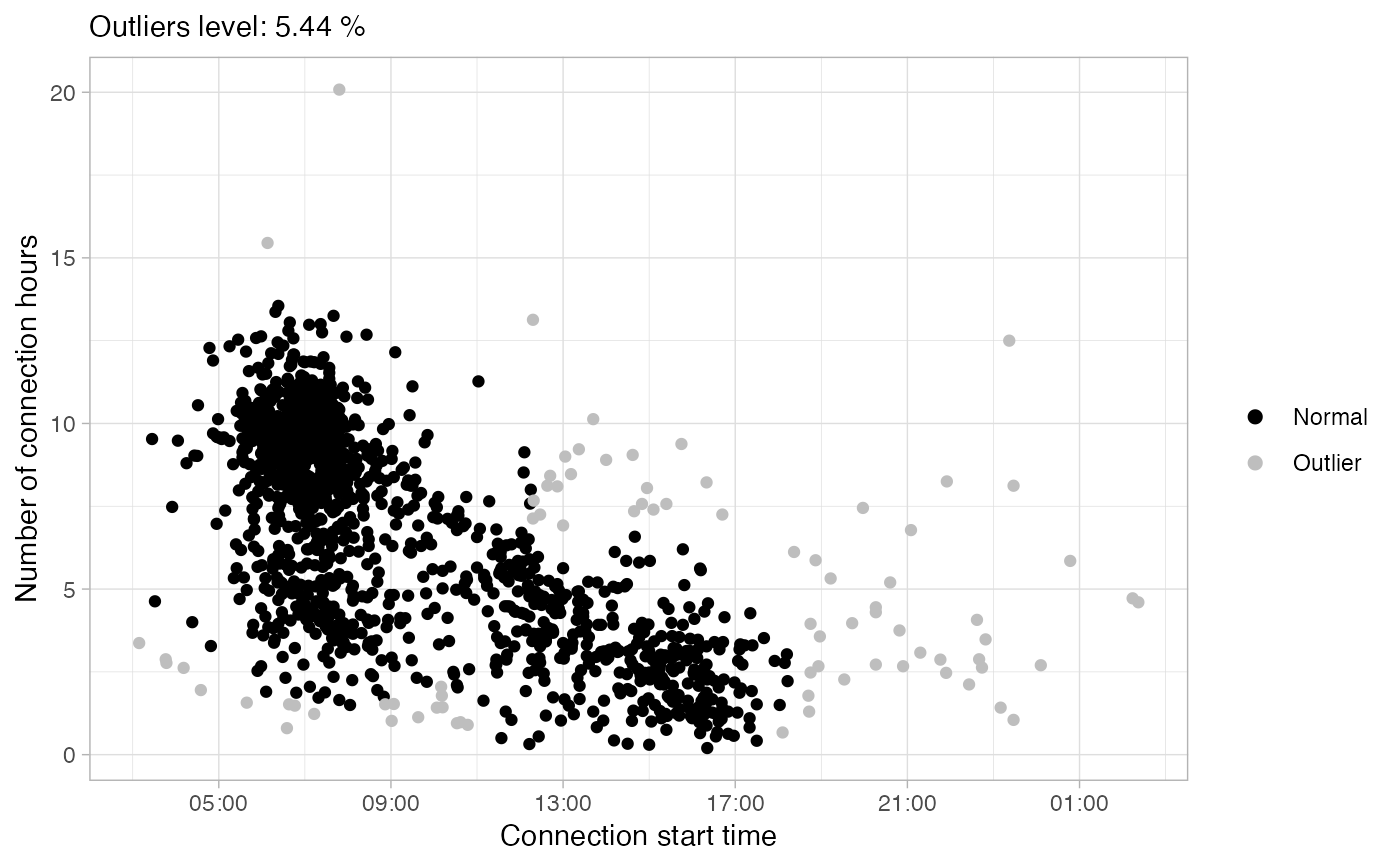
Plot outlying sessions
Arguments
- sessions
tibble, sessions data set in evprof standard format
- start
integer, start hour in the x axis of the plot.
- log
logical, whether to transform
ConnectionStartDateTimeandConnectionHoursvariables to natural logarithmic scale (base =exp(1)).- ...
arguments to pass to function ggplot2::plot_point
Examples
library(dplyr)
sessions_outliers <- california_ev_sessions %>%
  sample_frac(0.05) %>%
  detect_outliers(start = 3, noise_th = 5, eps = 2.5)
#> Trying with MinPts = 200 and eps = 2.5
#> Solution found: MinPts= 200 , eps = 2.412
plot_outliers(sessions_outliers, start = 3)

plot_outliers(sessions_outliers, start = 3, log = TRUE)